Population Per Square Mile for Meeting Sites, 2004
Population Size
Racial and Ethnic Diversity
Age and Gender
Education and Employment
Physicians
Hospitals and Other Health Care Facilities
Medicaid
Medicare
Uninsured
The Citizens’ Health Care Working Group held meetings across the country to hear what people had to say about health care. A core set of 31 Community Meetings were held between January and May 2006. These were structured similarly, and each included the use of electronic devices allowing individuals to provide responses to questions that were the same as, or very similar to, questions also asked on the Working Group’s Internet Poll. In addition to these meetings, about 40 other meetings, organized either by the Working Group, individual members, or other groups across the United States, provided input to the Working Group.1
Because the structure of the 31 Community Meetings allows us, with appropriate cautions, to compare what we heard from meeting to meeting, the meetings were the focal point of the Working Group’s efforts to engage in a national dialogue. The main criterion for selecting locations for these meetings was reaching as wide a spectrum of communities as possible in the time available. This Appendix provides profiles of these communities to illustrate diversity amongst them. The measures included are population demographics, population health status, and the availability of various health resources. The data represent the Metropolitan Statistical Area (MSA), except where such level of analysis would be inappropriate. For readability, data are summarized and highs and lows are presented. The source of the data is the 2005 Area Resource File data set provided by the Health Resources and Services Administration, Department of Health and Human Services, unless noted otherwise.
| • Albuquerque, New Mexico | • Little Rock, Arkansas |
| • Baton Rouge, Louisiana | • Los Angeles, California |
| • Billings, Montana | • Memphis, Tennessee |
| • Charlotte, North Carolina | • Miami, Florida |
| • Cincinnati, Ohio | • New York, New York |
| • Denver, Colorado | • Orlando, Florida |
| • Des Moines, Iowa | • Philadelphia, Pennsylvania |
| • Detroit, Michigan | • Phoenix, Arizona |
| • Eugene, Oregon | • Providence, Rhode Island |
| • Fargo, North Dakota | • Sacramento, California |
| • Hartford, Connecticut | • Salt Lake City, Utah |
| • Indianapolis, Indiana | • San Antonio, Texas |
| • Jackson, Mississippi | • Seattle, Washington |
| • Kansas City, Missouri | • Sioux Falls, South Dakota |
| • Las Vegas, Nevada | • Tucson, Arizona |
| • Lexington, Kentucky |
The meeting sites were diverse on several measures, including their population size, rural populations, racial composition, and population age. The following figures provide some insight on these and other characteristics of the communities visited. Just as there is no "typical" U.S. community, there was no "typical" site for a community meeting.
– The areas visited ranged in size from 144,472 in Billings, MT to over 18 million in the New York metropolitan statistical area (MSA). Of the 31 areas visited, 11 had fewer than one million people, 16 had between one and five million people, and four had over five million people.
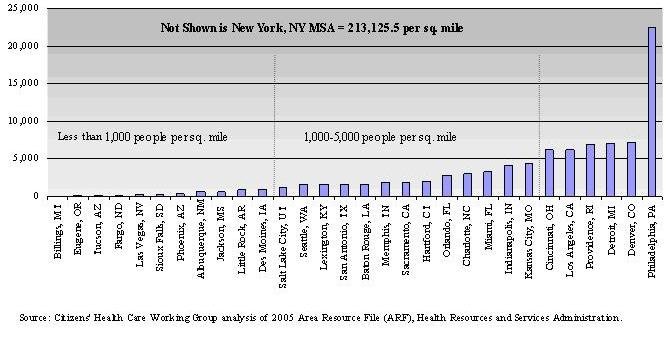
– In 2004, the population per square mile also had a tremendous range, from 55.9 people per square mile in Billings, MT to 213,125.5 people per square mile in the New York, NY MSA. As shown in Figure A1, 11 of the areas visited had population densities less than 1,000 people per square mile. Thirteen areas had between 1,000 and 4,999 people per square mile, and 7 areas had 5,000 or more people per square mile.
Figure A1:
Population Per Square Mile for Meeting Sites, 2004
– The meeting sites included both rural and urban MSAs. Five areas had more than 20 percent of its population living in rural areas (Baton Rouge, LA, Billings, MT, Jackson, MS, Little Rock, AR, and Sioux Falls, SD). Six areas had less than 5 percent of their population in rural areas, including Los Angeles, CA, New York, NY, Miami, FL, Las Vegas, NV, Salt Lake City, UT, and Phoenix, AZ.
– In 2000, 75 percent of the U.S. population was White, 12 percent was Black/African-American, and 13 percent was of another race or combination of races. Of the 31 meeting sites, five had Black/African-American populations greater than 20 percent (see Figure A2), nine had between 10 and 20 percent of the population as Black/African-American, and 17 had 10 percent or less of this population group.
Figure A2:
Prevalence of Black/African-American Populations in Meeting Sites, 2000
| MSAs with Black/African-Americans as a Share of the Population: | ||
| Less than 10% | 10-20% | More than 20% |
| Albuquerque, NM Billings, MT Denver, CO Des Moines, IA Eugene, OR Fargo, ND Hartford, CT Las Vegas, NV Los Angeles, CA Phoenix, AZ Providence, RI Sacramento, CA Salt Lake City, UT San Antonio, TX Seattle, WA Sioux Falls, ND Tucson, AZ |
Charlotte, NC Cincinnati, OH Indianapolis, IN Kansas City, MO Lexington, KY Miami, FL New York, NY Orlando, FL Philadelphia, PA |
Baton Rouge, LA Detroit, MI Jackson, MS Little Rock, AR Memphis, TN |
Source: Citizens’ Health Care Working Group analysis of 2005 Area Resource File (ARF), Health Resources and Services Administration.
– Of the 31 areas visited, 11 had Hispanic populations (of any race) greater than the U.S. average of 12.5 percent in 2000 (see Figure A3). In San Antonio, TX half of the population was of Hispanic or Latino descent while Albuquerque, NM and Los Angeles, CA both had populations of 41 percent Hispanic.
Figure A3:
Prevalence of Hispanic Populations in Meeting Sites, 2000
| MSAs with Persons of Hispanic/Latino Origin as a Share of the Population: | ||
| Less than U.S. Share (12.5%) | 12.5-20% | More than 20% |
| Baton Rouge, LA Billings, MT Charlotte, NC Cincinnati, OH Des Moines, IA Detroit, MI Eugene, OR Fargo, ND Hartford, CT Indianapolis, IN Jackson, MS Kansas City, MO Lexington, KY Little Rock, AR Memphis, TN Philadelphia, PA Providence, RI Salt Lake City, UT Seattle, WA Sioux Falls, SD |
Denver, CO New York, NY Orlando, FL Sacramento, CA |
Albuquerque, NM Las Vegas, NV Los Angeles, CA Miami, FL Phoenix, AZ San Antonio, TX Tucson, AZ |
Source: Citizens’ Health Care Working Group analysis of 2005 Area Resource File (ARF), Health Resources and Services Administration.
– The age distributions of the areas visited varied. Salt Lake City, UT had the largest proportion of persons under age 25 (43.3 percent); Miami, FL had the smallest percent (31.5 percent). In Indianapolis, IN, 17.3 percent were age 65 and older while in Salt Lake City, UT only 8 percent were seniors. Figure A4 gives examples of age distributions for nine small, medium, and large communities visited by the Working Group.
Figure A4:
Summary of Age Distributions, by Population Size, 2000
| MSA | 2000 Population | Percent Age 0-24 |
Percent Age 25-44 |
Percent Age 45-64 |
Percent Age 65+ |
| Fargo, ND | 174,367 | 40.2% | 29.7% | 19.5% | 10.6% |
| Eugene, OR | 322,959 | 34.8% | 27.5% | 24.4% | 13.3% |
| Des Moines, IA | 481,394 | 35.1% | 31.5% | 21.8% | 11.5% |
| Little Rock, AR | 610,518 | 35.5% | 30.7% | 22.4% | 11.3% |
| Salt Lake City, UT | 968,858 | 43.3% | 30.7% | 18.1% | 8.0% |
| Charlotte, NC | 1,328,839 | 34.7% | 35.2% | 20.3% | 15.0% |
| Indianapolis, IN | 1,524,707 | 35.5% | 32.9% | 21.0% | 17.3% |
| Miami, FL | 5,007,564 | 31.5% | 30.2% | 21.8% | 16.4% |
| New York, NY | 18,323,002 | 33.4% | 31.7% | 22.3% | 12.6% |
| U.S. | 281,421,906 | 35.3% | 30.2% | 22.0% | 12.4% |
Source: Citizens’ Health Care Working Group analysis of 2005 Area Resource File (ARF), Health Resources and Services Administration.
– For the most part, the meeting sites were evenly split in terms of the percentages of men and women, just like the U.S. as a whole (49.1 percent men in 2000). Jackson, MS had the lowest percentage of men (47.7 percent); Las Vegas, NV had the largest (50.9 percent).
– In 2000, the majority of adults age 25 and older in each of the communities had achieved at least a high school diploma, although there was some variation across geographic areas. In the Los Angeles, CA area, 72.2 percent of adults had completed at least high school while in the Fargo, ND area, 89.7 percent had completed high school education or above that level. In the U.S. as a whole, 80.4 percent of adults age 25 and older had at least a high school diploma.
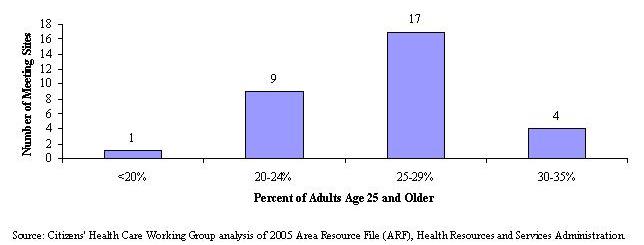
– As shown in Figure A5, in 21 of the meeting sites, more than 25 percent of adults age 25 or older had completed four or more years of college in 2000. In the United States, 24.4 percent had completed four or more years of college.
Figure A5:
Adults Age 25 and Older with 4 or More Years of College, 2000
– Unemployment rates also varied across sites. While the unemployment rate
in the Sioux Falls, SD area was 2.8 percent in 2000, Los Angeles, CA faced unemployment
of 7.4 percent. The national unemployment rate in 2000 was somewhere in between,
at 5.8 percent. The Working Group visited 12 places with unemployment rates
of 5.8 percent or higher and 19 with rates lower than the national average.
– In 2004, 8.4 percent of the U.S. population were veterans of the military.
Of the 31 sites hosting Community Meetings, the Charlotte, NC area had the largest
portion of veterans (22.5 percent), while Los Angeles, CA had the smallest percentage
(4.7 percent). Twenty-one of the meeting sites reported veteran populations
less than 10 percent of their populations. The other 10 areas had veteran populations
of 10 percent or higher.
– In 2003, the per capita income for the U.S. was $31,472.2 Of the 31 MSAs visited, 14 had per capita incomes less than the U.S. average, 17 had per capita incomes greater than the U.S. figure. Per capita incomes in the meeting sites ranged from $25,853 in Tucson, AZ to $40,963 in the New York, NY MSA (see Figure A6).
Figure A6:
Per Capita Income for Meeting Sites, 2003
| MSAs with Per Capita Income Less Than U.S. Average $31,472 | MSAs with Per Capita Income More Than U.S. Average $31,472 | ||
| MSA | 2003 Per Capita Income | MSA | 2003 Per Capita Income |
| Tucson, AZ | $25,853 | Memphis, TN | $31,665 |
| Eugene, OR | $26,316 | Providence, RI | $31,742 |
| Baton Rouge, LA | $26,878 | Lexington, KY | $32,012 |
| San Antonio, TX | $27,315 | Cincinnati, OH | $32,974 |
| Orlando, FL | $28,103 | Miami, FL | $33,023 |
| Jackson, MS | $28,143 | Sioux Falls, SD | $33,272 |
| Albuquerque, NM | $28,584 | Charlotte, NC | $33,289 |
| Billings, MT | $29,181 | Los Angeles, CA | $33,324 |
| Phoenix, AZ | $29,589 | Kansas City, MO | $33,356 |
| Salt Lake City, UT | $29,779 | Des Moines, IA | $33,695 |
| Little Rock, AR | $29,975 | Indianapolis, IN | $33,732 |
| Fargo, ND | $30,767 | Detroit, MI | $36,000 |
| Las Vegas, NV | $30,938 | Philadelphia, PA | $37,055 |
| Sacramento, CA | $31,436 | Hartford, CT | $38,196 |
| - | - | Seattle, WA | $39,012 |
| - | - | Denver, CO | $39,215 |
| - | - | New York, NY | $40,963 |
Source: Citizens’ Health Care Working Group analysis of 2005 Area Resource File (ARF), Health Resources and Services Administration. Note: The Area Resource File uses income data from the U.S. Department of Commerce, Bureau of Economic Analysis. Income figures from this source differ from those reported by the U.S. Bureau of Census.
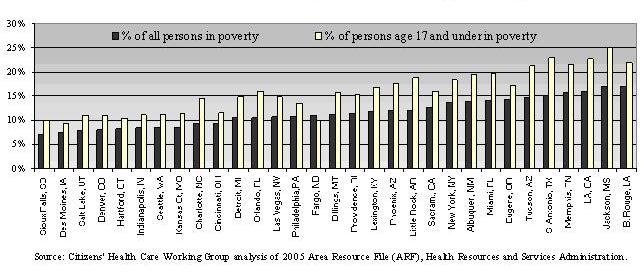
– The percentage of persons living with incomes below the federal poverty level (FPL) in 1999 ranged from 7.1 percent in Sioux Falls, SD to 17.1 percent in Baton Rouge, LA (see Figure A7). Twenty-two areas had 12.7 percent of the population (the national average) or less living in poverty.
– For children age 17 and under, the percentage living with incomes below poverty ranged from 9.3 percent in Des Moines, IA to 25 percent in Jackson, MS.
Figure A7:
Percent of All Persons and Those Age 17 and Under Living in Poverty, 1999
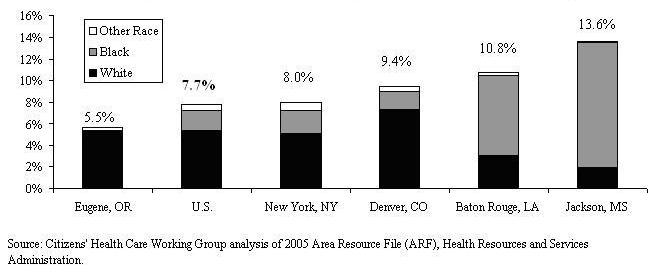
– Figure A8 shows a summary of the average percentage of births for 2000-2002 that were low birth weight by race of the birth mother. Eugene, OR had the smallest proportion of low-weight births with 5.5 percent, and Jackson, MS had the largest proportion with 13.6 percent. The other counties highlighted show the variation for highly populated areas like New York, NY as well as smaller areas like Baton Rouge, LA. The counties of the community meetings also showed diversity in the percent of births receiving early prenatal care. On average in the U.S., 81.5 percent of births got early prenatal care between 2000 and 2002. Philadelphia, PA had the lowest percentage of births for early prenatal care (67.2 percent), Des Moines, IA the highest (89.3 percent).
Figure A8:
Summary of Low Birth Weight Percentages for Meeting Site Counties, by Race,
2000-2002
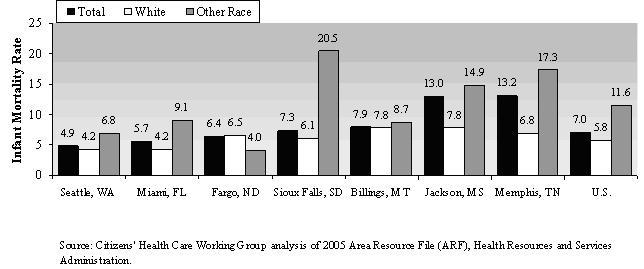
– The infant mortality rates (infant deaths per 1,000 births) in the counties visited ranged from 4.9 in Seattle, WA to 13.2 in Memphis, TN (average for 1998-2002). Racial disparity for infant mortality is also evident across the counties visited. The infant mortality rates for births to White mothers ranged from 4.2 in Miami, FL and Seattle, WA to 7.8 in Billings, MT and Jackson, MS. In contrast, the range in mortality rates for births to mothers of other races was 4.0 in Fargo, ND to 20.5 in Sioux Falls, SD. Figure A9 summarizes the infant mortality rates for the counties with highest and lowest rates for each racial category.
Figure A9:
Summary of Average Infant Mortality Rates in Meeting Site Counties, by Race,
1998-2002
– For most counties visited, close to half of all deaths were due to one of four major diseases—heart disease, cancer, chronic lower respiratory diseases, or diabetes, on average between 2000 and 2002. Four counties had less than 45 percent of deaths from these major diseases (with the lowest being 38 percent in Salt Lake City, UT), 22 counties had 45 to 55 percent of deaths from these diseases, and five counties had more than 55 percent of deaths due to major disease (with the highest being 57 percent in Providence, RI).
Figure A10:
Percentage of Deaths Due to Major Disease in Meeting Site Counties, 2000-2002
Percentage of Deaths from Heart Disease,
Cancer, Chronic Respiratory Disease, or Diabetes,: |
||
| Less than 45% | 45-55% | More than 55% |
| Charlotte, NC Denver, CO Jackson, MS Salt Lake City, UT |
Albuquerque, NM Baton Rouge, LA Billings, MT Cincinnati, OH Detroit, MI Eugene, OR Fargo, ND Hartford, CT Indianapolis, IN Kansas City, MO Las Vegas, NV Lexington, KY Little Rock, AR Memphis, TN Orlando, FL Philadelphia, PA Phoenix, AZ Sacramento, CA San Antonio, TX Seattle, WA Sioux Falls, SD Tucson, AZ |
Des Moines, IA Los Angeles, CA Miami, FL New York, NY Providence, RI |
Source: Citizens’ Health Care Working Group analysis of 2005 Area Resource File (ARF), Health Resources and Services Administration.
– In 2004, there were over 760,000 nonfederal physicians who were actively practicing in the U.S. This figure averages to about 26 physicians per 10,000 people. Of the 31 areas visited, nine MSAs had 26 or fewer nonfederal active physicians per 10,000, and 22 areas had more than 26 physicians per 10,000 people. The highest ratio of physicians was in Lexington, KY, where there were 48 physicians per 10,000 people. The smallest ratio was in Las Vegas, NV, where there were 17 physicians per 10,000 residents.
– The vast majority of physicians in almost every MSA visited were specialists. In 2004, the range of general practitioners, including general practice, general family medicine, and family medicine subspecialties, was from two per 10,000 residents in eight different meeting sites to six per 10,000 in Sioux Falls, SD. In contrast, the range of all types of specialists was between 14 per 10,000 residents (in Las Vegas, NV) and 36 per 10,000 residents (in New York, NY).
– Figure A11 gives a snapshot of the diversity in hospital resources available in a few of the MSAs visited. The sites chosen demonstrate the often noted relationship between the size of the area and the number of short-term general hospitals, ambulatory surgery centers, and hospices. Larger areas tend to have more of these types of facilities. However, population size is less related to the number of rural health clinics, community mental health centers, and federally qualified health centers.
– Veterans Administration (VA) hospitals were present in 24 of the MSAs visited. Twenty areas had one VA hospital. Figure A11 shows the four areas that had more than one VA hospital available—Miami, FL, Philadelphia, PA, Los Angeles, CA, and New York, NY.
Figure A11:
Summary of Number of Hospitals and Other Health Facilities in Meeting Sites
MSA |
Population (2004) |
Short Term General Hospitals (2003)
|
Veterans' Hospitals (2003) |
Ambulatory Surgery Centers (2004)
|
Hospices (2004) |
Rural Health Clinics (2004) |
Community Mental Health Centers
(2004) |
Federally Qualified Health Centers
(2004) |
| Billings, MT | 144,472 |
3 |
0 |
4 |
2 |
1 |
0 |
2 |
| Sioux Falls, SD | 203,324 |
7 |
1 |
3 |
3 |
7 |
0 |
2 |
| Eugene, OR | 331,594 |
4 |
0 |
9 |
3 |
5 |
1 |
3 |
| Salt Lake City, UT | 1,018,826 |
10 |
1 |
16 |
13 |
2 |
1 |
8 |
| Cincinnati, OH | 2,058,221 |
21 |
1 |
26 |
11 |
2 |
3 |
24 |
| Detroit, MI | 4,493,165 |
37 |
1 |
23 |
16 |
0 |
1 |
8 |
| Miami, FL | 5,361,723 |
54 |
2 |
61 |
11 |
4 |
68 |
31 |
| Philadelphia, PA | 5,800,614 |
58 |
3 |
66 |
45 |
0 |
14 |
34 |
| Los Angeles, CA | 12,925,330 |
117 |
2 |
229 |
59 |
0 |
3 |
40 |
| New York, NY | 18,709,802 |
143 |
5 |
151 |
56 |
1 |
22 |
63 |
Source: Citizens’ Health Care Working Group analysis of 2005 Area Resource File (ARF), Health Resources and Services Administration.
– Each state had its own income thresholds for Medicaid eligibility for working parents. In 2005 it ranged from 19 percent of the federal poverty level (FPL) in Arkansas to 200 percent of the FPL in Arizona. About half (15) of the areas visited had state-wide income eligibility levels for working parents that were below the national average (67 percent of FPL), eight areas had state levels at or above 100 percent of the FPL.3
– State residents may also enroll in Medicaid if they qualify for Supplemental Security Income (SSI). Again, each state sets its own levels for being eligible for SSI. Over half of the areas visited (19) were in states that established SSI eligibility at 73.8 percent of the FPL. The two areas visited in California (Los Angeles and Sacramento) had SSI eligibility of 100.2 percent of the FPL.4
– The federal Medicare program provides vital health coverage for seniors age 65 and over and certain disabled workers under the age of 65. The percentage of the non-elderly population eligible for Medicare because of disability, 14.7 percent of the U.S. Medicare population in 2003, varied considerably. In Miami, FL, 9.9 percent of Medicare beneficiaries were disabled beneficiaries, while in Kansas City, MO, 14.6 percent were disabled and in Jackson, MS and Little Rock, AR, over one-fifth were disabled (22.0 percent and 20.5 percent, respectively).
– Medicare adjusted average per capita costs (AAPCC) for aged beneficiaries serve as an additional marker of the diversity in the areas of the community meetings. Three counties had the lowest AAPCC of the sites visited—$555.42; fifteen counties were at $613.89; and seven counties had rates above $700. The highest payment rate was $904.51 in Miami, FL. While the average per capita costs reflects differences in the prices of services, it also reflects variation in the amount of services and the intensity of care used.
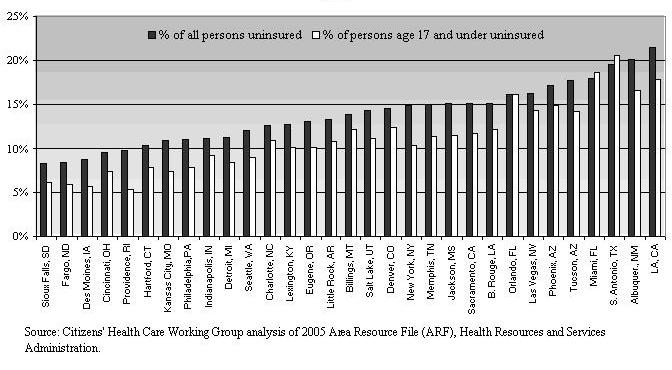
– In 2000, 14.2 percent of the U.S. population did not have health insurance. About half of the areas visited (16) had uninsured rates less than the national average. Sioux Falls, SD had the smallest percent of uninsured persons (8.2 percent) and Los Angeles, CA had the largest percentage (21.5 percent).
– Figure A12 below shows that in all but three areas (Orlando and Miami, FL and San Antonio, TX), a larger percentage of children age 17 and under were uninsured, compared with the percentages for all people.
Figure A12:
Percent of All Persons and Those Age 17 and Under Without Health Insurance,
2000
– The areas visited by the Working Group also show variation in the rates of utilization of medical care services. In 2003, the rate of inpatient hospital visits in short-term general hospitals (per 1,000 persons) ranged from 404 in Eugene, OR to 1,378 in Sioux Falls, SD. Four meeting sites had inpatient visits rates of over 1,000—Billings, MT, Jackson, MS, Little Rock, AR, and Sioux Falls, SD.
– In 2003, the number of short-term general hospital outpatient visits per 1,000 persons ranged from 931 in Eugene, OR to 7,902 in Billings, MT.
– Emergency department visits in 2003 in short-term general hospitals ranged from 193 per 1,000 people in Sacramento, CA to 576 per 1,000 people in Jackson, MS. Figure A13 below summarizes the highs and lows for inpatient, outpatient, and ED visits.
Figure A13:
Summary of Visits per 1,000 Populations in Meeting Sites, 2003
MSA (Sorted by Inpatient Visits) |
Inpatient visits per 1,000 pop. |
Outpatient visits per 1,000 pop.
|
Short-Term General ED visits per
1,000 pop. |
| Sioux Falls, SD | 1,378 |
2,887 |
276 |
| Jackson, MS | 1,317 |
2,163 |
576 |
| Billings, MT | 1,237 |
7,902 |
321 |
| Little Rock, AR | 1,194 |
2,746 |
441 |
| New York, NY | 896 |
2,049 |
361 |
| Philadelphia, PA | 795 |
1,862 |
368 |
| Detroit, MI | 610 |
2,135 |
362 |
| Los Angeles, CA | 542 |
1,189 |
250 |
| Sacramento, CA | 462 |
1,183 |
193 |
| Salt Lake City, UT | 437 |
2,494 |
323 |
| Eugene, OR | 404 |
931 |
306 |
Source: Citizens’ Health Care Working Group analysis of 2005 Area Resource File (ARF), Health Resources and Services Administration.
1 In addition to these meetings, several other types of meetings expanded the scope of the Working Group’s outreach. Special Topic Community meetings were held to explore several issues of special concern, and a national webcast hosted by the University of Michigan included town hall meetings held at 22 participating universities; members conducted meetings; and a variety of organizations held their own meeting using materials developed by the Working Group.
2 The Area Resource File uses income data from the U.S. Department of Commerce, Bureau of Economic Analysis. Income figures from this source differ from those reported by the U.S. Bureau of Census.
3 Kaiser Family Foundation website www.statehealthfacts.org.
4 Lynda Flowers, Leigh Gross, Patricia Kuo, Shelly-Ann
Sinclair, State Profiles: Reforming the Health Care System 2005, AARP
Public Policy Institute, Washington, DC, February 2006.